Teaching Statistics is Now More Important Than Ever
According to the 2020 High School Directory, only 132 out of 427 high schools (not including charters) in the city offer instruction in statistics. Among them, 113 offer Advanced Placement (AP) statistics, which covers college-level material; the rest offer statistics or quantitative reasoning as an elective or alternative math course. (There may be other schools that teach it but don’t mention it in the directory).
These numbers are too low. Now more than ever, statistics should be a required course at all high schools.
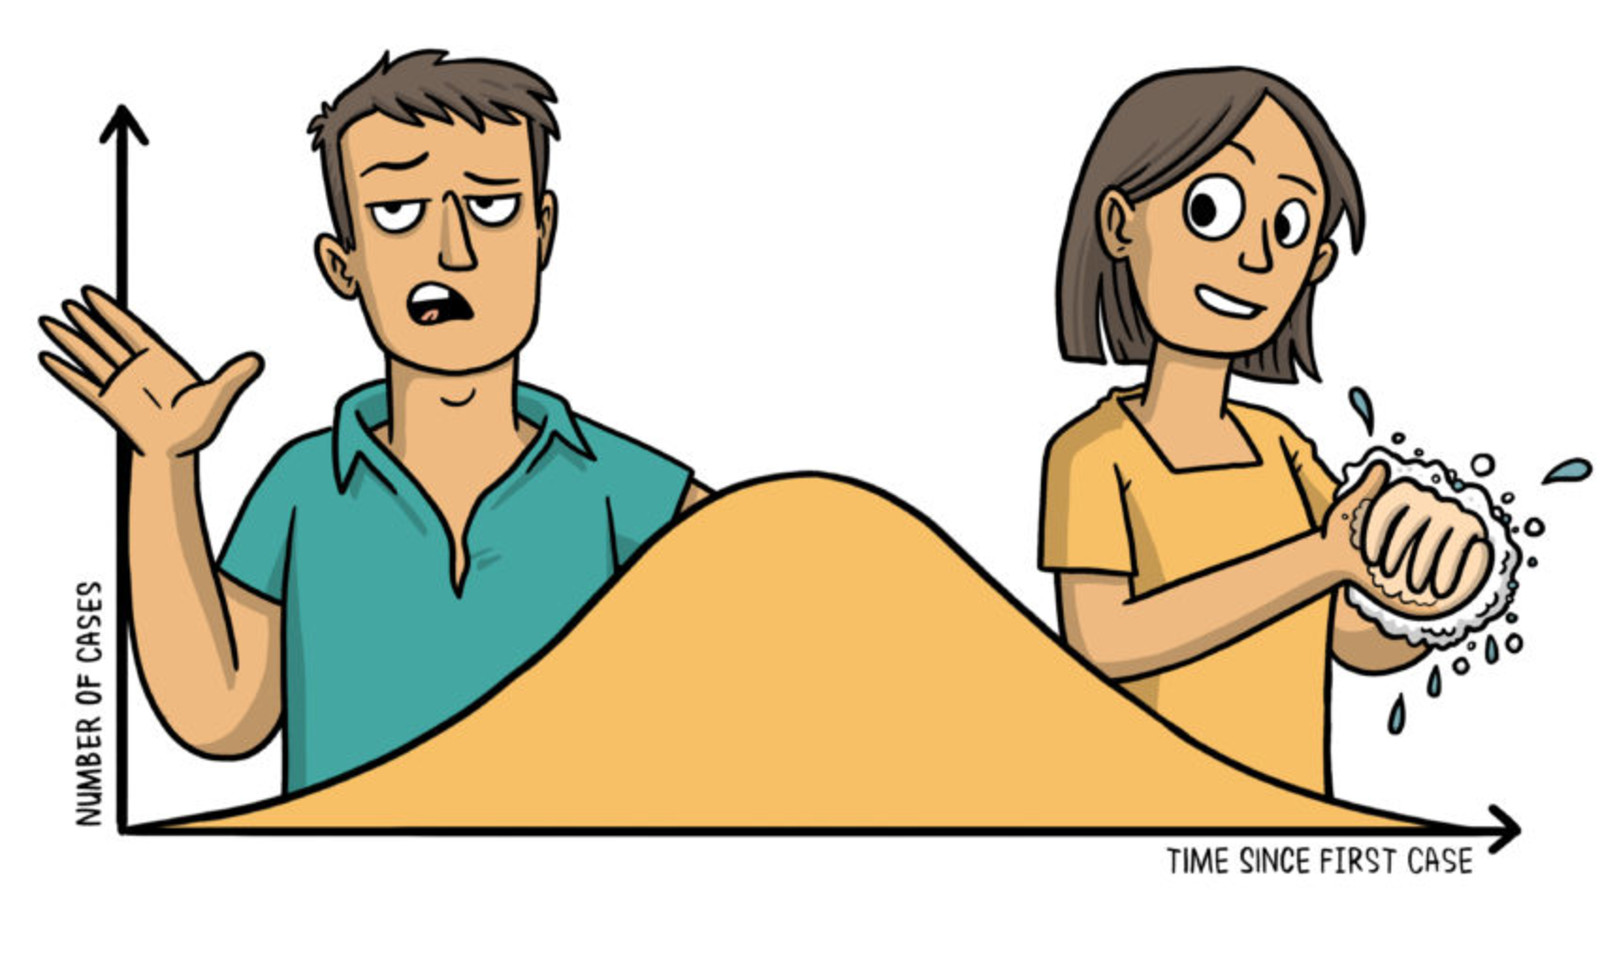
Statistical literacy is essential for our public and environmental health, a functioning democracy and full participation in society. The 2016 election firmly entrenched us in an era of “fake news” and science denialism that threatens all of these values. And now, the coronavirus pandemic has made it shockingly clear how important good data, clear communication and expert knowledge are for our lives and livelihoods. Just consider the importance of “flattening the curve,” a statistical concept and data visualization that convinced most of us of the importance of sheltering in place, even before the actual infection numbers looked dire in our own neighborhoods.
We need to be giving our students the tools to critically assess what they are seeing on TV and the internet and to make informed decisions, like this group of teens at MediaWise are doing with dozens of videos on Instagram and YouTube that fact check what politicians and media outlets have been saying about coronavirus.
Requiring statistics does not necessarily mean adding another math or AP class. Statistical concepts cut across all academic disciplines and skill levels, and can be taught through themes like journalism and media literacy, government and economics, public and personal health, climate science, computer science, or quantitative research skills like all freshmen take at Millennium Brooklyn High School.
Classes with younger students or those with less-developed math skills can focus on concepts of basic probability, exploring data, and creating and interpreting graphs that will reinforce key math skills no matter which department they are taught under. More advanced courses could explore concepts like how surveys and experiments are designed, how to interpret the results, and what can and can’t be inferred from them. Schools could offer a sequence of both, or could choose which level best suits their student population.
If all students are exposed to the statistical fundamentals, we will be giving them the tools to better understand the world around them that they will use for the rest of their lives. How many of you are still using what you learned in Algebra 2?
Tell us what you think in the COMMENTS below.
(Image via Toby Morris at The Spinoff)

Please Post Comments