Beyond test scores: Introducing our new tool to evaluate schools
It’s tricky to use data to evaluate a school, and we all wrestle with confusing and sometimes conflicting information. It’s hard to know: Will my children be safe? Are the teachers effective? Does the school prepare students for college?
Now, we’ve redesigned our website to try to answer these and many other questions about the city’s 1,800 district and charter schools as well as 1,200 stand-alone pre-kindergarten programs.
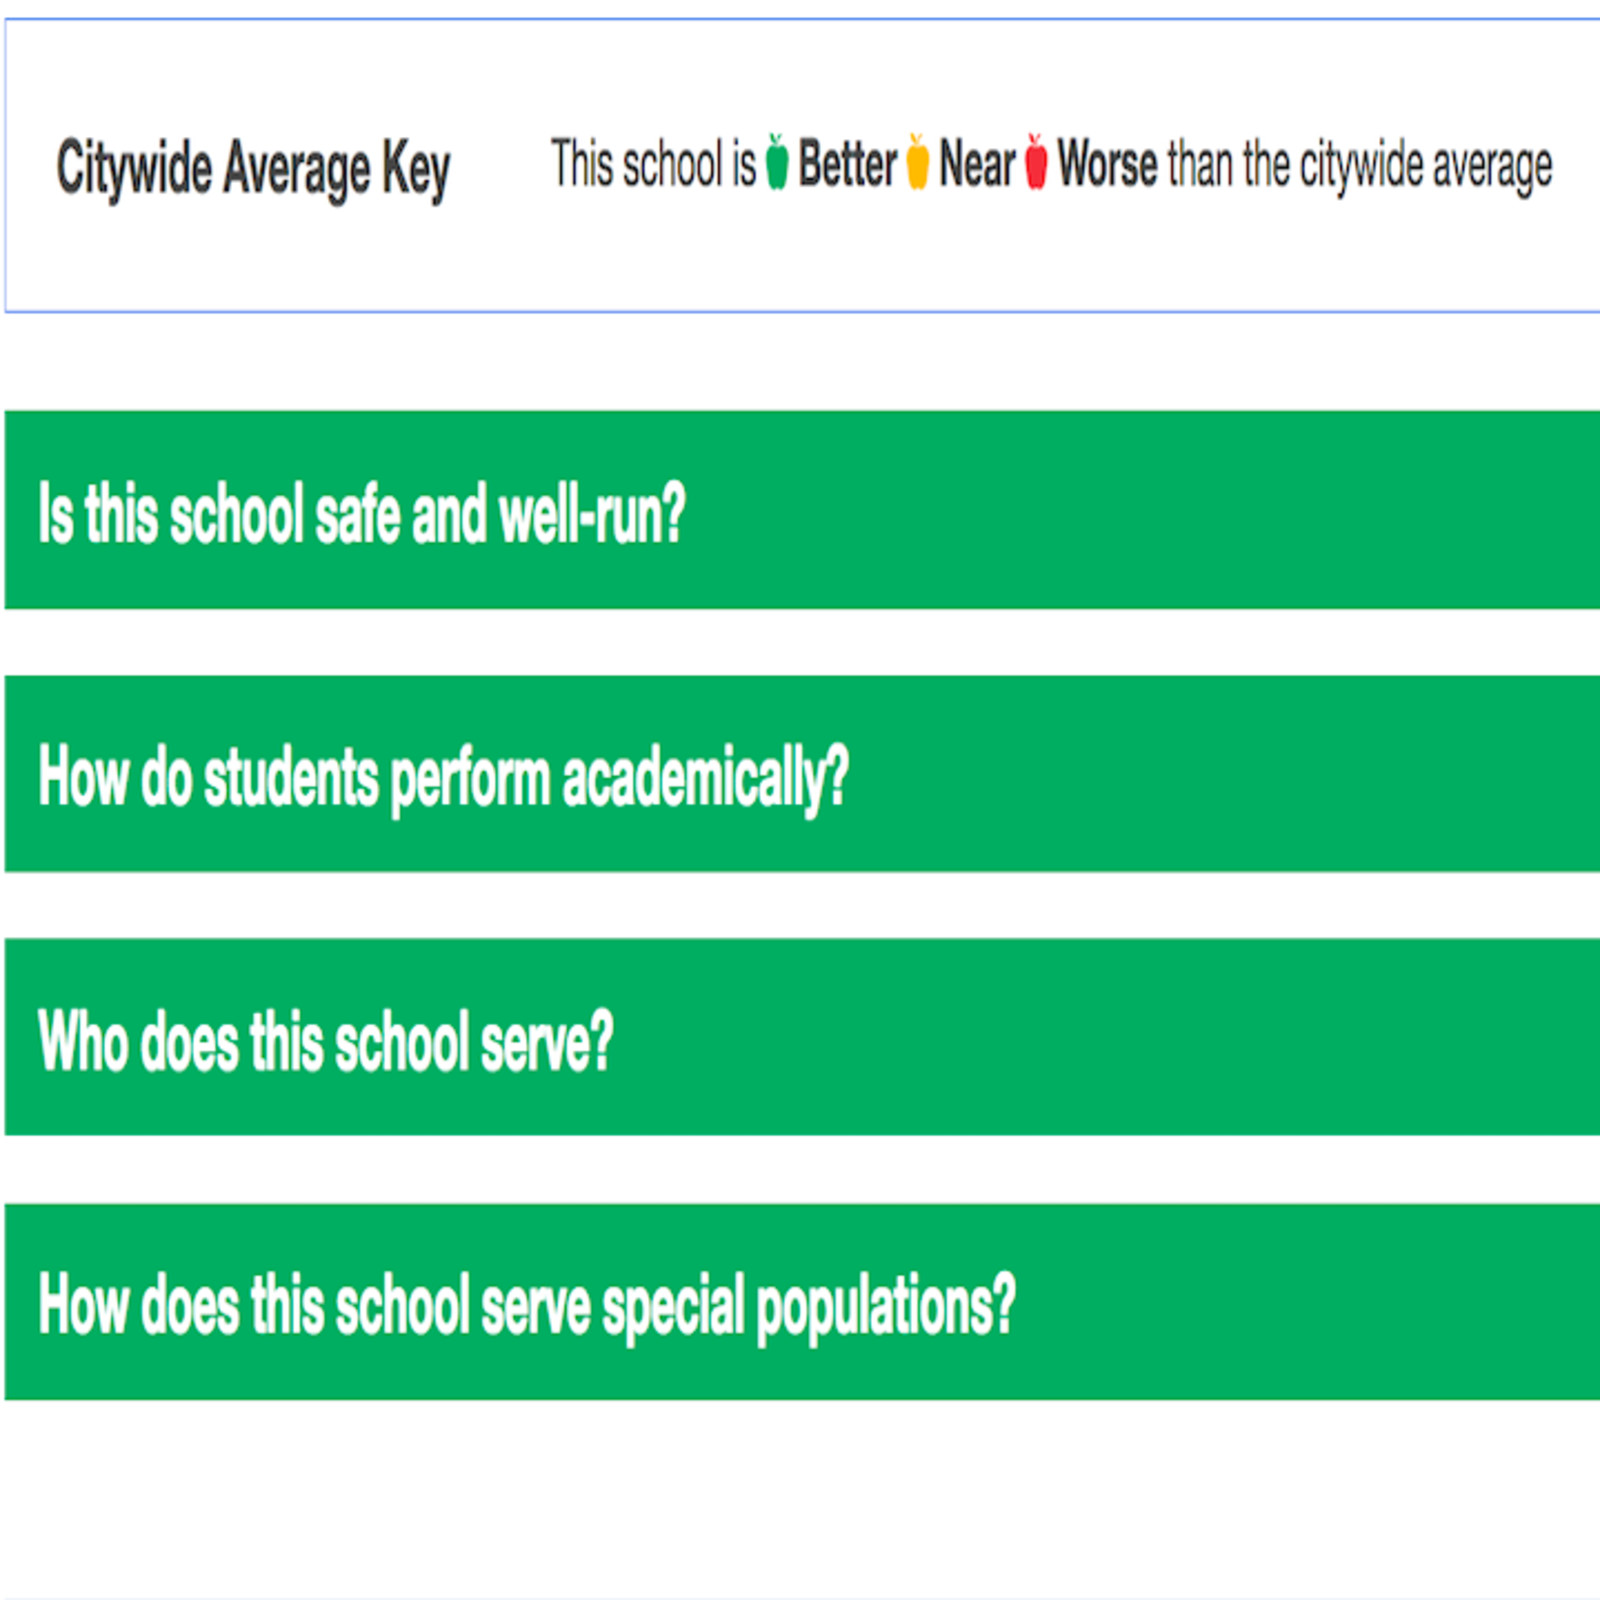
We have pulled 50 data points from 15 city and state sources and arranged them in an easy-to-read format with five categories:
- Is this school safe and well-run?
- How do students perform academically?
- What is the Pre-K like?
- Who does this school serve?
- How does this school serve special populations?
To use this tool, search for schools, select one you like and then click on "school stats" on that school's profile page.
Our new data visualization adds information on Pre-k quality, teacher effectiveness, student suspensions, college persistence, and teacher turnover. We updated information on enrollment; test scores; graduation rates; and student and teacher responses to city surveys on safety, climate and school leadership.
We have high school graduation rates not only for general education students but also for those who are learning English and those who receive special education services.
In response to user feedback, we clarified the language describing each data point, removing jargon that is unfamiliar to our readers. For example, instead of listing the rate of “chronic absenteeism” we now say “How many students miss 18 or more days of school?” Instead of “college readiness” we say “How many students graduate with test scores high enough to enroll at CUNY without remedial help?”
We also state clearly the source for and date for each data point, with appropriate links to the state education department and city Department of Education.
We give schools one to four stars for “teacher effectiveness,” based on the evaluation of pedagogy in the city’s “Quality Review.” We assigned stars based on the school’s rating: underdeveloped = 1 star; developing = 2 stars; proficient = 3 stars; well-developed = 4 stars.
For pre-kindergarten, we draw on two evaluations by the city, Classroom Assessment Scoring System (CLASS) and the Early Childhood Environmental Rating System (ECERS-R). We assigned stars based on the school’s rating: poor = 1 star; fair = 2 stars; good = 3 stars; excellent = 4 stars.
None of these sources is perfect, and there is no substitute for visiting a school to learn more about it. But we hope our new statistics pages will help you better understand each school’s strengths and weaknesses.

Please Post Comments